


The mean is the average: add the values and divide by how many there are. The median is the middle value when the data is sorted (the average of the two middle values if there’s an even number). The mode is the value that appears most often. The range is the largest value minus the smallest. For 3, 5, 5, 6, 11: mean 6, median 5, mode 5, range 8.
Mean, median and mode are three different ways to describe the “typical” value in a set of data. They often give different answers, and choosing the right one can change the story the numbers tell. This guide defines each one precisely, shows how to find them, and explains when each is the best choice.
Definitions at a glance
| Measure | How to find it | Example: 3, 5, 5, 6, 11 |
|---|---|---|
| Mean | sum ÷ count | ( frac{30}{5} = 6 ) |
| Median | middle of the sorted list | 5 |
| Mode | most frequent value | 5 |
| Range | maximum − minimum | ( 11 – 3 = 8 ) |
The mean
$$bar{x} = frac{sum x}{n} = frac{x_1 + x_2 + dots + x_n}{n}$$
Example 1. Test scores 85, 90, 78, 92, 88: sum 433, so the mean is ( frac{433}{5} = 86.6 ).
The mean uses every value, which makes it the most informative average, but also the most sensitive to extreme values (outliers). It’s the balance point of the data: the deviations above it exactly cancel those below.
Finding a missing value. If four scores average 80 and three of them are 75, 82 and 90, then the fourth is ( 4 times 80 – (75 + 82 + 90) = 73 ).
Weighted mean. If a course grade is 40% homework (score 90) and 60% exam (score 70): ( 0.4(90) + 0.6(70) = 78 ).
The median
- Sort the data from smallest to largest.
- If n is odd, the median is the middle value, in position ( frac{n + 1}{2} ).
- If n is even, it’s the mean of the two middle values.
Example 2 (odd n). 7, 2, 9, 4, 5 sorted is 2, 4, 5, 7, 9; the median is 5.
Example 3 (even n). 2, 4, 4, 4, 5, 5, 7, 9: the middle values are the 4th and 5th, 4 and 5, so the median is 4.5.
The median isn’t affected by how extreme the largest or smallest values are, which makes it the better “typical” value for skewed data like incomes and house prices.
The mode
The mode is the most frequent value. A data set can have:
- one mode (unimodal): 2, 4, 4, 4, 5, 5, 7, 9 has mode 4;
- two modes (bimodal): 1, 2, 2, 3, 3, 4 has modes 2 and 3;
- no mode: 1, 2, 3, 4, where every value appears once.
The mode is the only average that works for non-numerical data: the modal shoe colour, the most common answer on a survey.
Mean, median and mode calculator
Paste your numbers to get all three, plus the range and standard deviation.
For this data the mean, median and mode are all 15. The full-page standard deviation calculator also has more examples.
Which average should you use?
| Situation | Best measure | Why |
|---|---|---|
| Symmetric data, no outliers | mean | uses all the information |
| Skewed data or outliers (incomes, house prices) | median | not pulled by extremes |
| Categories or most common choice | mode | the only one that works |
Example 4: the effect of an outlier. Five salaries: $40k, $42k, $45k, $48k, $300k. The mean is $95k, which describes nobody; the median, $45k, is much more representative. When a news report says “average income”, it matters which one they mean.

Skewness clue. In right-skewed data (a long tail of large values), mean > median. However, in left-skewed data, mean < median. In symmetric data they’re about equal.
Frequency tables
When data comes as values with frequencies:
| Value x | Frequency f | fx |
|---|---|---|
| 1 | 4 | 4 |
| 2 | 7 | 14 |
| 3 | 6 | 18 |
| 4 | 3 | 12 |
| Total | 20 | 48 |
- Mean ( = frac{sum fx}{sum f} = frac{48}{20} = 2.4 ).
- Median: with 20 values, it’s the average of the 10th and 11th. The first 4 are 1s and the next 7 (5th–11th) are 2s, so the median is 2.
- Mode: 2 (frequency 7).
Measures of spread
An average alone hides how spread out the data is. The simplest measure is the range; the interquartile range (Q3 − Q1) ignores the extremes; the standard deviation uses every value. See the standard deviation formula for details, and z-scores for comparing a value with the mean.
Mean in calculus
The average of a continuous function over an interval is the integral version of the mean:
$$f_{text{avg}} = frac{1}{b - a}int_a^b f(x),dx$$
It’s covered in the average value of a function guide.
Common mistakes
- Not sorting before finding the median.
- Choosing a middle value when n is even. Average the two middle values instead.
- Saying there’s no mode when two values tie. Then there are two modes.
- Using the mean for skewed data.
Printable formula sheet
Mean, median, mode, spread and the other core statistics formulas are in a free printable PDF.
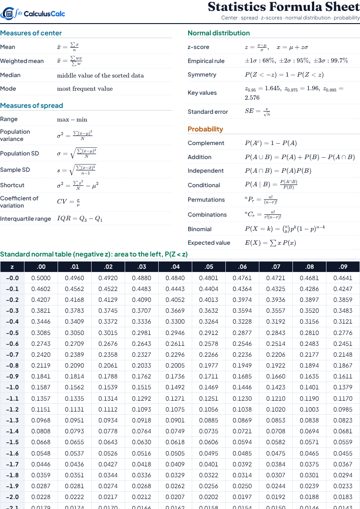
Statistics Formula Sheet + Z-Table
Mean, standard deviation, z-scores, the normal distribution and probability, with full negative and positive z-tables.
Download the Statistics Formula Sheet + Z-Table (PDF) Open in browserPractice problems
- Find the mean, median and mode of 4, 8, 6, 5, 8, 3, 8.
- Find the median of 10, 2, 7, 5.
- The mean of 6 numbers is 12. Five of them add to 58. Find the sixth.
- Find the modes of 1, 1, 2, 3, 3, 4.
- Which average best describes house prices in a town with a few mansions?
Answers: (1) mean 6, median 6, mode 8; (2) 6; (3) 14; (4) 1 and 3; (5) the median.
FAQ
How do you find the mean?
Add all the values and divide by the number of values.
How do you find the median?
Sort the values; the median is the middle one, or the average of the two middle ones if there’s an even count.
How do you find the mode?
Count how often each value appears; the mode is the most frequent. There can be more than one, or none.
What is the difference between mean and median?
The mean is the arithmetic average and is affected by every value, including outliers. However, the median is the middle value and ignores how extreme the ends are.
What is the range in math?
The difference between the largest and smallest values.
Further reading
- Arithmetic mean (Wikipedia) — definition and properties of the mean.
- Median (Wikipedia) — the median, its robustness and calculation.
- OpenStax Introductory Statistics 2e — free chapters on measures of center and spread.
Calculators for this topic
Keep learning
Z-Score Formula and Z Table (Standard Normal Table)
The z-score formula, how to read a z table, normal probabilities and percentiles, comparing scores, and a complete standard normal table.
Standard Deviation Formula: How to Calculate It, Step by Step
The standard deviation formula for samples and populations, a step-by-step method, variance, the 68-95-99.7 rule, grouped data, and worked examples.