

A z-score tells you how many standard deviations a value is from the mean: ( z = frac{x – mu}{sigma} ). A z table (standard normal table) gives the area to the left of z under the normal curve, ( P(Z < z) ). For example, ( z = 1.5 ) has ( P(Z < 1.5) = 0.9332 ): the value is higher than about 93% of the distribution. Use ( P(Z > z) = 1 – P(Z < z) ) for the right tail and ( P(Z < -z) = 1 – P(Z < z) ) for negative z.
Z-scores put values from different scales on a common footing: a test score, a height and a reaction time can all be compared once you know how unusual each is. Combined with the normal distribution, they turn into probabilities and percentiles. This guide covers the formula, how to read the table (the full table is below), and the standard problem types.
The z-score formula
$$z = frac{x - mu}{sigma}$$

- x is the value, ( mu ) the mean, ( sigma ) the standard deviation.
- ( z > 0 ): above the mean. ( z < 0 ): below the mean. ( z = 0 ): exactly the mean.
- To go back from z to a value: ( x = mu + zsigma ).
For a sample, use ( z = frac{x – bar{x}}{s} ). See the standard deviation formula for ( sigma ) and s.
Example 1. IQ scores have mean 100 and SD 15. An IQ of 130 has ( z = frac{130 – 100}{15} = 2 ): two standard deviations above the mean.
How to read the z table
The table below gives ( P(Z < z) ) for ( z ge 0 ). The row gives z to one decimal place and the column gives the second decimal.

Example 2. For ( z = 1.25 ), go to row 1.2 and column .05: 0.8944. So 89.44% of values lie below a z-score of 1.25.
Negative z. The normal curve is symmetric, so ( P(Z < -z) = 1 – P(Z < z) ). For ( z = -0.5 ): ( 1 – 0.6915 = 0.3085 ).
Standard normal table: P(Z < z)
| z | .00 | .01 | .02 | .03 | .04 | .05 | .06 | .07 | .08 | .09 |
|---|---|---|---|---|---|---|---|---|---|---|
| 0.0 | 0.5000 | 0.5040 | 0.5080 | 0.5120 | 0.5160 | 0.5199 | 0.5239 | 0.5279 | 0.5319 | 0.5359 |
| 0.1 | 0.5398 | 0.5438 | 0.5478 | 0.5517 | 0.5557 | 0.5596 | 0.5636 | 0.5675 | 0.5714 | 0.5753 |
| 0.2 | 0.5793 | 0.5832 | 0.5871 | 0.5910 | 0.5948 | 0.5987 | 0.6026 | 0.6064 | 0.6103 | 0.6141 |
| 0.3 | 0.6179 | 0.6217 | 0.6255 | 0.6293 | 0.6331 | 0.6368 | 0.6406 | 0.6443 | 0.6480 | 0.6517 |
| 0.4 | 0.6554 | 0.6591 | 0.6628 | 0.6664 | 0.6700 | 0.6736 | 0.6772 | 0.6808 | 0.6844 | 0.6879 |
| 0.5 | 0.6915 | 0.6950 | 0.6985 | 0.7019 | 0.7054 | 0.7088 | 0.7123 | 0.7157 | 0.7190 | 0.7224 |
| 0.6 | 0.7257 | 0.7291 | 0.7324 | 0.7357 | 0.7389 | 0.7422 | 0.7454 | 0.7486 | 0.7517 | 0.7549 |
| 0.7 | 0.7580 | 0.7611 | 0.7642 | 0.7673 | 0.7704 | 0.7734 | 0.7764 | 0.7794 | 0.7823 | 0.7852 |
| 0.8 | 0.7881 | 0.7910 | 0.7939 | 0.7967 | 0.7995 | 0.8023 | 0.8051 | 0.8078 | 0.8106 | 0.8133 |
| 0.9 | 0.8159 | 0.8186 | 0.8212 | 0.8238 | 0.8264 | 0.8289 | 0.8315 | 0.8340 | 0.8365 | 0.8389 |
| 1.0 | 0.8413 | 0.8438 | 0.8461 | 0.8485 | 0.8508 | 0.8531 | 0.8554 | 0.8577 | 0.8599 | 0.8621 |
| 1.1 | 0.8643 | 0.8665 | 0.8686 | 0.8708 | 0.8729 | 0.8749 | 0.8770 | 0.8790 | 0.8810 | 0.8830 |
| 1.2 | 0.8849 | 0.8869 | 0.8888 | 0.8907 | 0.8925 | 0.8944 | 0.8962 | 0.8980 | 0.8997 | 0.9015 |
| 1.3 | 0.9032 | 0.9049 | 0.9066 | 0.9082 | 0.9099 | 0.9115 | 0.9131 | 0.9147 | 0.9162 | 0.9177 |
| 1.4 | 0.9192 | 0.9207 | 0.9222 | 0.9236 | 0.9251 | 0.9265 | 0.9279 | 0.9292 | 0.9306 | 0.9319 |
| 1.5 | 0.9332 | 0.9345 | 0.9357 | 0.9370 | 0.9382 | 0.9394 | 0.9406 | 0.9418 | 0.9429 | 0.9441 |
| 1.6 | 0.9452 | 0.9463 | 0.9474 | 0.9484 | 0.9495 | 0.9505 | 0.9515 | 0.9525 | 0.9535 | 0.9545 |
| 1.7 | 0.9554 | 0.9564 | 0.9573 | 0.9582 | 0.9591 | 0.9599 | 0.9608 | 0.9616 | 0.9625 | 0.9633 |
| 1.8 | 0.9641 | 0.9649 | 0.9656 | 0.9664 | 0.9671 | 0.9678 | 0.9686 | 0.9693 | 0.9699 | 0.9706 |
| 1.9 | 0.9713 | 0.9719 | 0.9726 | 0.9732 | 0.9738 | 0.9744 | 0.9750 | 0.9756 | 0.9761 | 0.9767 |
| 2.0 | 0.9772 | 0.9778 | 0.9783 | 0.9788 | 0.9793 | 0.9798 | 0.9803 | 0.9808 | 0.9812 | 0.9817 |
| 2.1 | 0.9821 | 0.9826 | 0.9830 | 0.9834 | 0.9838 | 0.9842 | 0.9846 | 0.9850 | 0.9854 | 0.9857 |
| 2.2 | 0.9861 | 0.9864 | 0.9868 | 0.9871 | 0.9875 | 0.9878 | 0.9881 | 0.9884 | 0.9887 | 0.9890 |
| 2.3 | 0.9893 | 0.9896 | 0.9898 | 0.9901 | 0.9904 | 0.9906 | 0.9909 | 0.9911 | 0.9913 | 0.9916 |
| 2.4 | 0.9918 | 0.9920 | 0.9922 | 0.9925 | 0.9927 | 0.9929 | 0.9931 | 0.9932 | 0.9934 | 0.9936 |
| 2.5 | 0.9938 | 0.9940 | 0.9941 | 0.9943 | 0.9945 | 0.9946 | 0.9948 | 0.9949 | 0.9951 | 0.9952 |
| 2.6 | 0.9953 | 0.9955 | 0.9956 | 0.9957 | 0.9959 | 0.9960 | 0.9961 | 0.9962 | 0.9963 | 0.9964 |
| 2.7 | 0.9965 | 0.9966 | 0.9967 | 0.9968 | 0.9969 | 0.9970 | 0.9971 | 0.9972 | 0.9973 | 0.9974 |
| 2.8 | 0.9974 | 0.9975 | 0.9976 | 0.9977 | 0.9977 | 0.9978 | 0.9979 | 0.9979 | 0.9980 | 0.9981 |
| 2.9 | 0.9981 | 0.9982 | 0.9982 | 0.9983 | 0.9984 | 0.9984 | 0.9985 | 0.9985 | 0.9986 | 0.9986 |
| 3.0 | 0.9987 | 0.9987 | 0.9987 | 0.9988 | 0.9988 | 0.9989 | 0.9989 | 0.9989 | 0.9990 | 0.9990 |
| 3.1 | 0.9990 | 0.9991 | 0.9991 | 0.9991 | 0.9992 | 0.9992 | 0.9992 | 0.9992 | 0.9993 | 0.9993 |
| 3.2 | 0.9993 | 0.9993 | 0.9994 | 0.9994 | 0.9994 | 0.9994 | 0.9994 | 0.9995 | 0.9995 | 0.9995 |
| 3.3 | 0.9995 | 0.9995 | 0.9995 | 0.9996 | 0.9996 | 0.9996 | 0.9996 | 0.9996 | 0.9996 | 0.9997 |
| 3.4 | 0.9997 | 0.9997 | 0.9997 | 0.9997 | 0.9997 | 0.9997 | 0.9997 | 0.9997 | 0.9997 | 0.9998 |
For ( z ge 3.5 ), ( P(Z < z) > 0.9998 ). However, the z-score calculator gives exact values for any z, including negatives and more decimals.
The four standard problem types
| Question | Calculation |
|---|---|
| Area to the left, ( P(Z < z) ) | read the table |
| Area to the right, ( P(Z > z) ) | ( 1 – ) table value |
| Area between, ( P(a < Z < b) ) | table(b) − table(a) |
| Value for a percentile | find the area inside the table, read z, then ( x = mu + zsigma ) |
Example 3 (right tail). What fraction of IQ scores exceed 130? ( z = 2 ), ( P(Z > 2) = 1 – 0.9772 = 0.0228 ), about 2.3%.

Example 4 (between). What fraction of IQ scores lie between 85 and 130? ( z ) runs from ( -1 ) to ( 2 ): ( 0.9772 – (1 – 0.8413) = 0.8186 ), about 81.9%.
Example 5 (percentile). What IQ is the 90th percentile? Find 0.90 inside the table: the closest entry is 0.8997 at ( z = 1.28 ). So ( x = 100 + 1.28 times 15 approx 119 ).
Example 6 (comparing). Ana scores 82 on a test with mean 70 and SD 8 (( z = 1.5 )); Ben scores 90 on a test with mean 80 and SD 10 (( z = 1.0 )). As a result, Ana did relatively better, even with a lower raw score.
Z-score calculator
Enter a value, mean and SD to get the z-score and all the probabilities without the table.
Key values worth memorizing
| z | Area to the left | Use |
|---|---|---|
| 1 | 0.8413 | about 68% within ±1 |
| 1.645 | 0.9500 | one-sided 95% |
| 1.96 | 0.9750 | 95% confidence intervals (±1.96) |
| 2 | 0.9772 | about 95% within ±2 |
| 2.576 | 0.9950 | 99% confidence intervals |
| 3 | 0.9987 | about 99.7% within ±3 |
The 68-95-99.7 rule is the quick version: about 68%, 95% and 99.7% of normal data lie within 1, 2 and 3 standard deviations of the mean.
Where the table comes from
The values are areas under the standard normal curve

$$phi(z) = frac{1}{sqrt{2pi}}e^{-z^2/2}$$
from ( -infty ) to z. This function has no elementary antiderivative, so the areas are computed numerically, which is what the calculator does. That the total area is exactly 1 depends on the famous result ( int_{-infty}^{infty}e^{-x^2},dx = sqrtpi ); see the integral of e^(x²) and improper integrals.
Common mistakes
- Using the variance instead of the SD in the denominator.
- Reading the wrong tail. However, the table gives the area to the left.
- Forgetting symmetry for negative z-scores.
- Applying normal probabilities to clearly non-normal data, such as strongly skewed incomes.
Printable formula sheet
The z-score formula and the full negative and positive z-tables are in a free printable PDF.
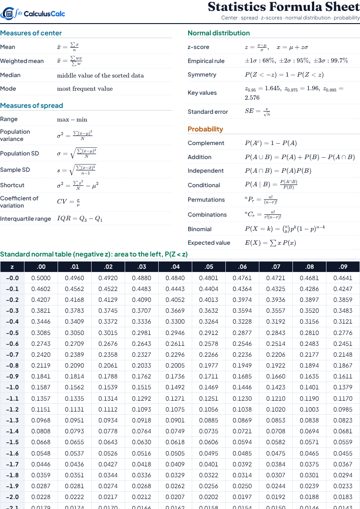
Statistics Formula Sheet + Z-Table
Mean, standard deviation, z-scores, the normal distribution and probability, with full negative and positive z-tables.
Download the Statistics Formula Sheet + Z-Table (PDF) Open in browserPractice problems
- Find z for ( x = 74 ), ( mu = 80 ), ( sigma = 4 ).
- Find ( P(Z < 0.84) ).
- Find ( P(Z > 1.10) ).
- Find ( P(-1.5 < Z < 1.5) ).
- Heights are normal with mean 170 cm and SD 8 cm. What percentage are taller than 186 cm?
Answers: (1) ( -1.5 ); (2) 0.7995; (3) ( 1 – 0.8643 = 0.1357 ); (4) ( 2(0.9332) – 1 = 0.8664 ); (5) ( z = 2 ), about 2.28%.
FAQ
What is the z-score formula?
( z = frac{x – mu}{sigma} ): the value minus the mean, divided by the standard deviation.
How do you read a z table?
Find the row for the first decimal of z and the column for the second decimal; the entry is the area to the left of z.
What does a z-score of 2 mean?
The value is 2 standard deviations above the mean, higher than about 97.7% of a normal distribution.
How do you find the probability for a negative z-score?
Use symmetry: ( P(Z < -z) = 1 – P(Z < z) ).
What z-score is the 95th percentile?
About 1.645.
Further reading
- Standard normal table (Wikipedia) — how z tables are built and read.
- Standard score (Wikipedia) — the z-score and its uses.
- OpenStax Introductory Statistics 2e — the normal distribution chapter, with exercises.
Calculators for this topic
Keep learning
Standard Deviation Formula: How to Calculate It, Step by Step
The standard deviation formula for samples and populations, a step-by-step method, variance, the 68-95-99.7 rule, grouped data, and worked examples.

Mean, Median and Mode: Definitions, Formulas and Examples
What mean, median, mode and range are, how to find each (even-sized data and frequency tables), and when to use which average.