
Standard Deviation Calculator (Mean, Median, Mode)
- Free
- No sign-up
- Works on phones
- Shows the working
 By Yasir Hafeez · Updated
This standard deviation calculator summarizes any list of numbers. Paste or type your data and it returns the count, sum, mean, median, mode, range, the population standard deviation ( sigma ) and variance, and the sample standard deviation ( s ) and variance, plus the sorted data.
It doubles as a mean, median and mode calculator. Also, it’s free and needs no sign-up.
How to use it
- Type or paste your numbers. Separate them with commas, spaces or new lines; decimals and negatives are fine.
- Press Calculate.
- Choose the right standard deviation: sample (s) if your data is a sample from a bigger group, population (( sigma )) if it’s every member of the group.
Formulas
$$bar{x} = frac{sum x}{n}, qquad sigma = sqrt{frac{sum(x - bar{x})^2}{n}}, qquad s = sqrt{frac{sum(x - bar{x})^2}{n - 1}}$$

The median is the middle value of the sorted data (the average of the two middle values when n is even). In addition, the mode is the most frequent value. The range is the largest minus the smallest.
Worked example
Data: 2, 4, 4, 4, 5, 5, 7, 9 (as loaded above).
Mean. ( frac{40}{8} = 5 ).
Deviations squared. ( 9, 1, 1, 1, 0, 0, 4, 16 ), which add to 32.
Population SD. ( sigma = sqrt{32/8} = sqrt4 = 2 ).
Sample SD. ( s = sqrt{32/7} approx 2.138 ).
Median ( = frac{4 + 5}{2} = 4.5 ); mode = 4 (three times); range ( = 9 – 2 = 7 ).
Sample or population?
| Use | When | Divide by |
|---|---|---|
| Population ( sigma ) | you have data for the whole group (every student in a class) | n |
| Sample s | your data is part of a larger group (a survey of 100 voters) | n − 1 |
Dividing by ( n – 1 ) (Bessel’s correction) corrects the tendency of a sample to underestimate the spread. Most real data is a sample, so s is the usual choice in statistics courses and software (Excel’s STDEV.S, Google Sheets’ STDEV).

Interpreting results from a standard deviation calculator
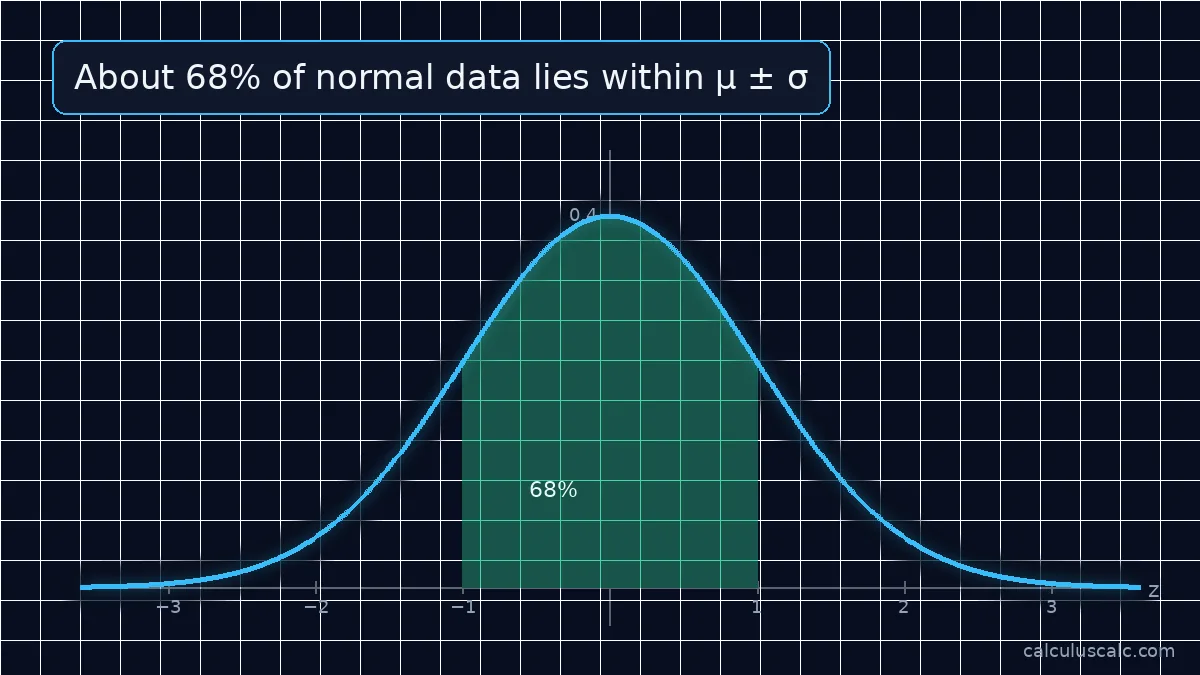
A small SD means the values cluster near the mean; a large one means they’re spread out. For roughly bell-shaped data, about 68% of values lie within 1 SD of the mean, 95% within 2 and 99.7% within 3. Also, to see where a single value falls, convert it to a z-score with the z-score calculator.

Common mistakes
- Using the wrong SD. Check whether you have a sample or a population.
- Forgetting to square the deviations. Unsquared deviations always add to zero.
- Forgetting the square root. Without it you have the variance.
- Median of unsorted data. Sort first.
Step by step by hand
For the sample 4, 8, 6, 5, 3, 7:
- Mean: \( (4 + 8 + 6 + 5 + 3 + 7) / 6 = 33 / 6 = 5.5 \).
- Deviations from the mean: −1.5, 2.5, 0.5, −0.5, −2.5, 1.5.
- Squares: 2.25, 6.25, 0.25, 0.25, 6.25, 2.25, which add up to 17.5.
- Sample variance: \( 17.5 / (6 - 1) = 3.5 \). Population variance: \( 17.5 / 6 \approx 2.917 \).
- Square root: sample \( s = \sqrt{3.5} \approx 1.871 \); population \( \sigma \approx 1.708 \).
The 68–95–99.7 rule
For data that are roughly normal:
- about 68% lie within 1 standard deviation of the mean,
- about 95% within 2,
- about 99.7% within 3.
If adult heights have mean 170 cm and standard deviation 8 cm, about 68% are between 162 and 178 cm and about 95% between 154 and 186 cm. Also, see the z-score calculator.
Coefficient of variation
To compare spread between data sets with different units or sizes, divide the standard deviation by the mean:
$$\text{CV} = \frac{s}{\bar{x}} \times 100\%$$
For the sample above, \( 1.871 / 5.5 \approx 34\% \). As a result, a CV of 5% means values are tightly clustered; 50% means they vary a lot relative to their size.
How one outlier changes it
Add the value 30 to the sample: the mean jumps from 5.5 to 9, and the sample standard deviation from 1.87 to about 9.42, five times larger. So, standard deviation is very sensitive to outliers. For skewed data, the median and interquartile range describe spread more robustly. See mean, median and mode.
Standard deviation from a frequency table
When values repeat, multiply each squared deviation by its frequency \( f \):
$$s = \sqrt{\frac{\sum f(x - \bar{x})^2}{\left(\sum f\right) - 1}}$$
Standard deviation in practice
- Quality control: a factory filling 500 g bags with a standard deviation of 2 g knows that nearly all bags (within 3 standard deviations) weigh between 494 and 506 g.
- Finance: the standard deviation of yearly returns is the usual measure of an investment’s risk (volatility).
- Science: error bars often show one standard deviation, so readers can see how much measurements vary.
Why divide by n − 1 for a sample?
A sample’s own mean sits closer to its values than the true population mean does, so squared deviations from it are slightly too small on average. Dividing by \( n - 1 \) instead of \( n \) (Bessel’s correction) makes the sample variance an unbiased estimate of the population variance. The difference matters for small samples and almost disappears for large ones.
Quick reference: which formula?
| Situation | Divide by | Symbol |
|---|---|---|
| Every member of the group (all 30 students in one class) | \( n \) | \( \sigma \) |
| A sample used to describe a bigger group (30 students from a school) | \( n - 1 \) | \( s \) |
Standard error vs standard deviation
Next, the standard deviation describes how spread out individual values are. The standard error, \( s/\sqrt{n} \), describes how precisely the sample mean estimates the true mean. With \( s = 10 \) and \( n = 100 \), single values typically vary by about 10, but the sample mean is uncertain by only about 1.
Practice problems
- Find the population standard deviation of 2, 4, 4, 4, 5, 5, 7, 9.
- Two classes both average 72 marks. Class A has \( s = 4 \), class B \( s = 12 \). However, which class has more similar scores?
Answers: 1. Mean 5, squared deviations add to 32, \( \sigma = \sqrt{32/8} = 2 \). 2. Class A: its scores are clustered more tightly around the mean.
Related guides
- Standard Deviation Formula: Step by Step
- Mean, Median and Mode
- Z-Score and the Z Table
- Average Value of a Function
Further reading
- Standard deviation (Wikipedia) — definitions, interpretation and the sample correction.
- OpenStax Introductory Statistics 2e — a free statistics textbook with chapters on descriptive statistics.
FAQ
How do you calculate standard deviation?
Find the mean, subtract it from each value, square the results, add them, divide by n (population) or n − 1 (sample), and take the square root.
What is the difference between sample and population standard deviation?
The population SD divides by n; the sample SD divides by n − 1, which makes it slightly larger.
What is a good standard deviation?
There’s no universal “good” value; it depends on the units and the mean. For example, compare it to the mean (the coefficient of variation is SD ÷ mean) or to other data sets.
Can standard deviation be negative?
No. It’s a square root of an average of squares, so it’s zero or positive.