

Standard deviation shows data spread around the mean. The population standard deviation is (sigma = sqrt{frac{sum(x – mu)^2}{N}}). The sample standard deviation is (s = sqrt{frac{sum(x – bar{x})^2}{n – 1}}). To use the standard deviation formula: first, find the mean. Subtract it from each value. Square these results. Add them up. Divide by N (or n − 1 for a sample). Finally, take the square root.
Two classes can have the same average test score while one has everyone within a few points and the other ranges from 20 to 100. The mean can’t tell them apart; the standard deviation can. This guide explains the formulas, walks through the calculation step by step, and shows how to interpret the result.
The formulas
| Population | Sample | |
|---|---|---|
| Mean | ( mu = frac{sum x}{N} ) | ( bar{x} = frac{sum x}{n} ) |
| Variance | ( sigma^2 = frac{sum(x – mu)^2}{N} ) | ( s^2 = frac{sum(x – bar{x})^2}{n – 1} ) |
| Standard deviation | ( sigma = sqrt{sigma^2} ) | ( s = sqrt{s^2} ) |
Variance is the average squared distance from the mean; the standard deviation is its square root, which brings the units back to those of the data (variance of heights in cm² becomes SD in cm).

Step by step
- Find the mean.
- Subtract the mean from each value (the deviations).
- Square each deviation (so negatives don’t cancel positives).
- Add the squares.
- Divide by N for a population, or ( n – 1 ) for a sample.
- Take the square root.
Example 1: a small data set
Data: 2, 4, 4, 4, 5, 5, 7, 9.
Mean: ( frac{40}{8} = 5 ).
| x | ( x – bar{x} ) | ( (x – bar{x})^2 ) |
|---|---|---|
| 2 | −3 | 9 |
| 4 | −1 | 1 |
| 4 | −1 | 1 |
| 4 | −1 | 1 |
| 5 | 0 | 0 |
| 5 | 0 | 0 |
| 7 | 2 | 4 |
| 9 | 4 | 16 |
| sum = 0 | sum = 32 |
Population: ( sigma^2 = frac{32}{8} = 4 ), so ( sigma = 2 ).
Sample: ( s^2 = frac{32}{7} approx 4.571 ), so ( s approx 2.138 ).
Notice the deviations add to zero (they always do), which is why we square them.
Example 2: test scores
Five test scores: 85, 90, 78, 92, 88. Mean ( = frac{433}{5} = 86.6 ). The squared deviations are 2.56, 11.56, 73.96, 29.16 and 1.96, summing to 119.2.
- Population SD: ( sqrt{119.2/5} = sqrt{23.84} approx 4.88 ).
- Sample SD: ( sqrt{119.2/4} = sqrt{29.8} approx 5.46 ).
Sample or population: which one?
- Use the population formula when your data includes every member of the group you care about (all 30 students in your class).
- Use the sample formula when your data is a subset used to estimate a larger group (30 students surveyed to learn about a whole school). This is far more common in practice.
Dividing by ( n – 1 ) instead of n (Bessel’s correction) makes the sample variance an unbiased estimate of the population variance. Intuitively, the sample mean sits closer to the sample’s own values than the true mean does, so the raw spread is slightly too small; dividing by a smaller number corrects it. In spreadsheets, STDEV.S (or STDEV) is the sample version and STDEV.P the population version.

Standard deviation calculator
Paste any list of numbers to get the mean, median, mode, and both standard deviations.
The full-page standard deviation calculator has more examples.
A shortcut formula
Expanding the square gives an equivalent formula that’s quicker by hand:
$$sigma^2 = frac{sum x^2}{N} - mu^2$$
For Example 1: ( sum x^2 = 4 + 16 + 16 + 16 + 25 + 25 + 49 + 81 = 232 ), so ( sigma^2 = frac{232}{8} – 25 = 4 ). (Computers avoid this form for huge data sets because of rounding, but it’s handy on paper.)
Grouped (frequency) data
When data is given as values with frequencies f:
$$bar{x} = frac{sum fx}{sum f}, qquad sigma = sqrt{frac{sum f(x - bar{x})^2}{sum f}}$$
Example. Shoe sizes: 6 (×2), 7 (×5), 8 (×3). Mean ( = frac{12 + 35 + 24}{10} = 7.1 ). ( sum f(x – bar{x})^2 = 2(1.21) + 5(0.01) + 3(0.81) = 4.9 ), so ( sigma = sqrt{0.49} = 0.7 ).
Interpreting standard deviation
The 68-95-99.7 rule. For data that’s roughly bell-shaped (normal):
| Range | Share of data |
|---|---|
| within 1 SD of the mean | about 68% |
| within 2 SD | about 95% |
| within 3 SD | about 99.7% |
If adult heights have mean 170 cm and SD 8 cm, about 95% of adults are between 154 and 186 cm. A value’s distance from the mean in SDs is its z-score; see z-score and the z table.
Coefficient of variation. ( frac{sigma}{mu} ) compares spread across data with different units or scales.
Effects of changing the data. Adding a constant to every value doesn’t change the SD. However, multiplying every value by k multiplies the SD by ( lvert krvert ).
Common mistakes
- Using n when you should use n − 1 (or the reverse).
- Forgetting to square the deviations, or forgetting the final square root.
- Rounding the mean too early. Keep full precision until the end.
- Confusing SD with standard error. The standard error of the mean is ( frac{s}{sqrt n} ), a different quantity.
Printable formula sheet
The standard deviation and variance formulas, with the rest of introductory statistics and a z-table, are in a free printable PDF.
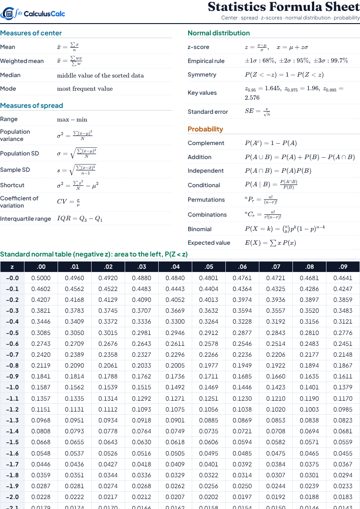
Statistics Formula Sheet + Z-Table
Mean, standard deviation, z-scores, the normal distribution and probability, with full negative and positive z-tables.
Download the Statistics Formula Sheet + Z-Table (PDF) Open in browserPractice problems
- Find the population SD of 1, 3, 5, 7, 9.
- Find the sample SD of 10, 12, 14.
- Find the population variance of 4, 4, 4, 4.
- A data set has mean 50 and SD 6. What range holds about 95% of the values (if normal)?
- If every value in a data set is doubled, what happens to the SD?
Answers: (1) ( sqrt8 approx 2.828 ); (2) 2; (3) 0; (4) 38 to 62; (5) it doubles.
FAQ
What is the formula for standard deviation?
Population: ( sigma = sqrt{frac{sum(x – mu)^2}{N}} ). Sample: ( s = sqrt{frac{sum(x – bar{x})^2}{n – 1}} ).
What is the difference between variance and standard deviation?
Variance is the average squared deviation from the mean; standard deviation is its square root, in the same units as the data.
Why divide by n − 1 for a sample?
To correct for the fact that a sample’s spread around its own mean underestimates the population’s spread. This is Bessel’s correction.
What does a standard deviation of 0 mean?
Every value is the same.
Is a high standard deviation good or bad?
Neither; it describes variability. For example, in manufacturing, low is usually wanted (consistent products); in investing, high means more risk.
Further reading
- Standard deviation (Wikipedia) — definitions, interpretation and the 68-95-99.7 rule.
- OpenStax Introductory Statistics 2e — a free textbook covering descriptive statistics in depth.
Calculators for this topic
Keep learning
Z-Score Formula and Z Table (Standard Normal Table)
The z-score formula, how to read a z table, normal probabilities and percentiles, comparing scores, and a complete standard normal table.

Mean, Median and Mode: Definitions, Formulas and Examples
What mean, median, mode and range are, how to find each (even-sized data and frequency tables), and when to use which average.