
Binomial Distribution Calculator (Probability Table)
- Free
- No sign-up
- Works on phones
- Shows the working
 By Yasir Hafeez · Updated
This binomial distribution calculator finds binomial probabilities: exactly k successes, at most k, fewer than k, at least k or more than k, out of n independent trials with success probability p. It shows the formula with your numbers, all five probabilities at once, the mean, variance and standard deviation, and, for up to 30 trials, a table of every probability and cumulative probability.
It’s free and needs no sign-up.
How to use it
- Enter the number of trials n.
- Enter the probability of success on each trial p, as a decimal (0.5, not 50%).
- Next, enter the number of successes k and choose which probability you want.
- Press Calculate.
when to use the binomial distribution calculator
A situation is binomial when all four conditions hold:
- A fixed number of trials n.
- Each trial has two outcomes: success or failure.
- The probability of success p is the same on every trial.
- The trials are independent.
Coin flips, multiple-choice guessing, defective items in a sample and free throws all fit.
Formula
The probability of exactly k successes is
$$P(X = k) = binom{n}{k} p^k (1 - p)^{n-k}$$
where ( binom{n}{k} ) counts the ways to choose which k trials are the successes (see the combination calculator). Cumulative probabilities add these up: ( P(X le k) = P(X = 0) + cdots + P(X = k) ).
The mean and standard deviation are
$$mu = np, qquad sigma = sqrt{np(1 - p)}$$
Worked example: 3 heads in 10 flips
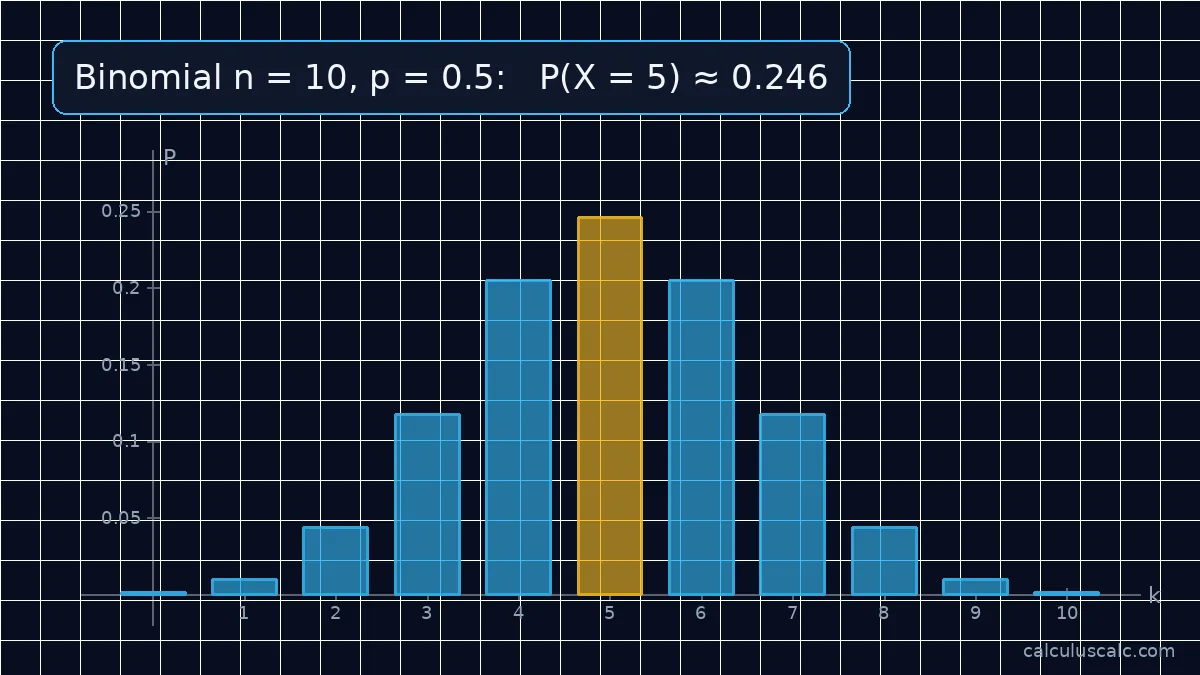
As loaded above, with n = 10, p = 0.5, k = 3:
$$P(X = 3) = binom{10}{3}(0.5)^3(0.5)^7 = 120 times frac{1}{1024} approx 0.1172$$
The calculator also gives ( P(X le 3) = 0.1719 ) and ( P(X ge 3) = 0.9453 ). The mean is ( 10 times 0.5 = 5 ) heads.
Worked example: quality control
A machine produces 5% defective parts. In a sample of 20, what is the probability of at least 2 defective ones? Use the complement:
$$P(X ge 2) = 1 - P(X = 0) - P(X = 1) = 1 - 0.95^{20} - 20(0.05)(0.95)^{19}$$
$$= 1 - 0.3585 - 0.3774 = 0.2642$$
So about 26% of samples will contain two or more defective parts. Enter n = 20, p = 0.05, k = 2 and choose “P(X ≥ k)”.
Worked example: guessing on a test
A quiz has 5 questions with 5 choices each. Guessing every answer, the chance of getting none right is ( 0.8^5 = 0.32768 ), about 33%. As a result, the expected score is ( 5 times 0.2 = 1 ) question.
“At least”, “at most” and the others
| Words | Probability |
|---|---|
| exactly k | ( P(X = k) ) |
| at most k, no more than k | ( P(X le k) ) |
| fewer than k | ( P(X < k) = P(X le k – 1) ) |
| at least k, k or more | ( P(X ge k) = 1 – P(X le k – 1) ) |
| more than k | ( P(X > k) = 1 – P(X le k) ) |
Normal approximation
When ( np ge 10 ) and ( n(1 – p) ge 10 ), the binomial distribution is close to a normal distribution with the same mean and standard deviation, so you can use a z-score (with a continuity correction of ±0.5). This calculator computes the exact binomial probabilities, so you don’t need the approximation, even for large n.
Common mistakes
- Mixing up “at least” and “at most”.
- Using percentages for p. Enter 0.05, not 5.
- Using the binomial when trials aren’t independent, such as drawing cards without replacement from a small deck.
Step-by-step
- Check the four conditions: fixed n, two outcomes, constant p, independent trials.
- Identify n, p and the values of k you need.
- Translate the words (“at least”, “at most”) into an inequality.
- Use the formula for each k, or the complement if it is shorter, and add.
Worked example: free throws
A basketball player makes 80% of free throws. In 10 attempts, the expected number made is ( mu = 10 times 0.8 = 8 ), with standard deviation ( sqrt{10 times 0.8 times 0.2} = sqrt{1.6} approx 1.26 ). Also, the chance of making all 10 is ( 0.8^{10} approx 0.107 ), about 11%.
Worked example: a fair coin, 12 tosses
What is the chance of 10 or more heads? With ( p = frac12 ) every sequence has probability ( frac{1}{4096} ), so
$$P(X ge 10) = frac{binom{12}{10} + binom{12}{11} + binom{12}{12}}{4096} = frac{66 + 12 + 1}{4096} = frac{79}{4096} approx 0.0193$$
Under 2%, so 10 heads in 12 tosses would make you suspect the coin.
The shape of the distribution
When ( p = 0.5 ) the distribution is symmetric about ( frac{n}{2} ). When p is small it is skewed right (most values near 0, a long tail to the right); when p is close to 1 it is skewed left. As n grows, it looks more and more like a bell curve, which is why the normal approximation works for large n.

Mean and variance: why np?
The number of successes is a sum of n independent 0/1 variables, each with mean p and variance ( p(1 – p) ). Means and variances of independent variables add, so the total has mean np and variance ( np(1 – p) ). See the standard deviation formula for how variance and standard deviation relate.
Practice problems
- ( n = 8 ), ( p = 0.25 ): find ( P(X = 2) ).
- ( n = 12 ), ( p = 0.5 ): find ( P(X ge 10) ).
- ( n = 5 ), ( p = 0.2 ): find ( P(X = 0) ).
Answers: 1. ( 28 times 0.25^2 times 0.75^6 approx 0.3115 ). 2. ( frac{79}{4096} approx 0.0193 ). 3. ( 0.8^5 = 0.32768 ).
Probabilities over a range
To find ( P(a le X le b) ), subtract cumulative probabilities: ( P(a le X le b) = P(X le b) – P(X le a – 1) ). For 10 fair coin flips, ( P(3 le X le 5) = P(X le 5) – P(X le 2) = 0.6230 – 0.0547 = 0.5684 ). The calculator’s table lists every ( P(X le k) ) for up to 30 trials, so you can read both values straight off it.

Related guides
Further reading
- Binomial distribution (Wikipedia) — formula, properties and approximations.
FAQ
What is the binomial probability formula?
( P(X = k) = binom{n}{k} p^k (1 – p)^{n-k} ): the number of ways to get k successes times the probability of any one such sequence.
What is the mean of a binomial distribution?
( mu = np ), the expected number of successes.
How do you find “at least” binomial probabilities?
Use the complement: ( P(X ge k) = 1 – P(X le k – 1) ).
What is the difference between binomial pdf and cdf?
The pdf (or pmf) gives ( P(X = k) ); the cdf gives the cumulative ( P(X le k) ). The calculator gives both.
What is the difference between binomial and normal distributions?
The binomial counts successes, so it takes whole-number values from 0 to n. In contrast, the normal is continuous. For large n, the binomial is approximately normal.
What is the most likely number of successes?
The mode is usually near np: it is the whole number ( lfloor (n + 1)p rfloor ) (and sometimes the one just below it too).